Software engineering teams live in their tools. An average developer context-switches between 13 different applications per day, according to a 2024 study by Sleuth.io — and that number hasn’t gone down. You check Sentry for errors, Codacy for code quality, Checkly for uptime, Retool for internal dashboards, BigQuery for analytics, PagerDuty for incidents, and Datadog for infrastructure metrics. Each one requires a different tab, a different login, a different mental context.
The cost of this fragmentation is well-documented. A University of California, Irvine study found it takes an average of 23 minutes and 15 seconds to fully regain focus after a context switch. For developers checking monitoring dashboards 10 times a day, that’s nearly 4 hours of lost deep work.
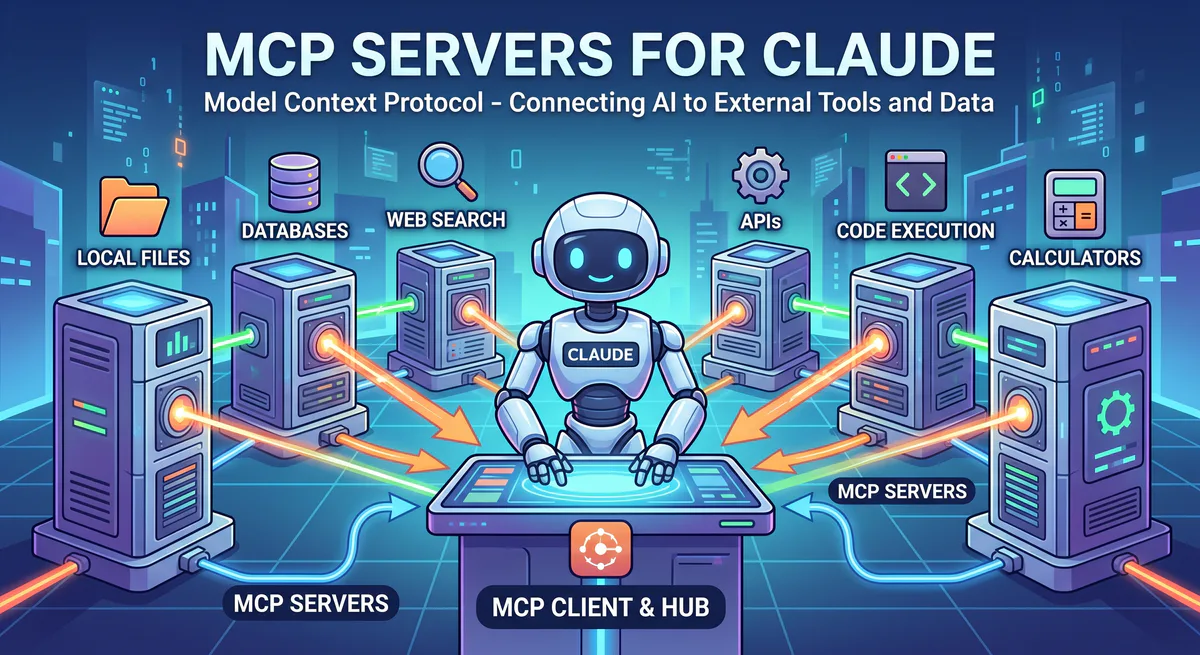
MCP servers solve this by bringing your tools to your AI, instead of bringing you to your tools. When Claude, Cursor, or VS Code has direct access to your developer infrastructure, every cross-tool question becomes a single prompt:
“Are there any critical errors in Sentry from the last hour? Cross-reference with the Checkly uptime data. If something’s down, check Datadog metrics for the affected service and create a summary for the incident channel.”
One prompt. Four tools. Zero tab-switching.
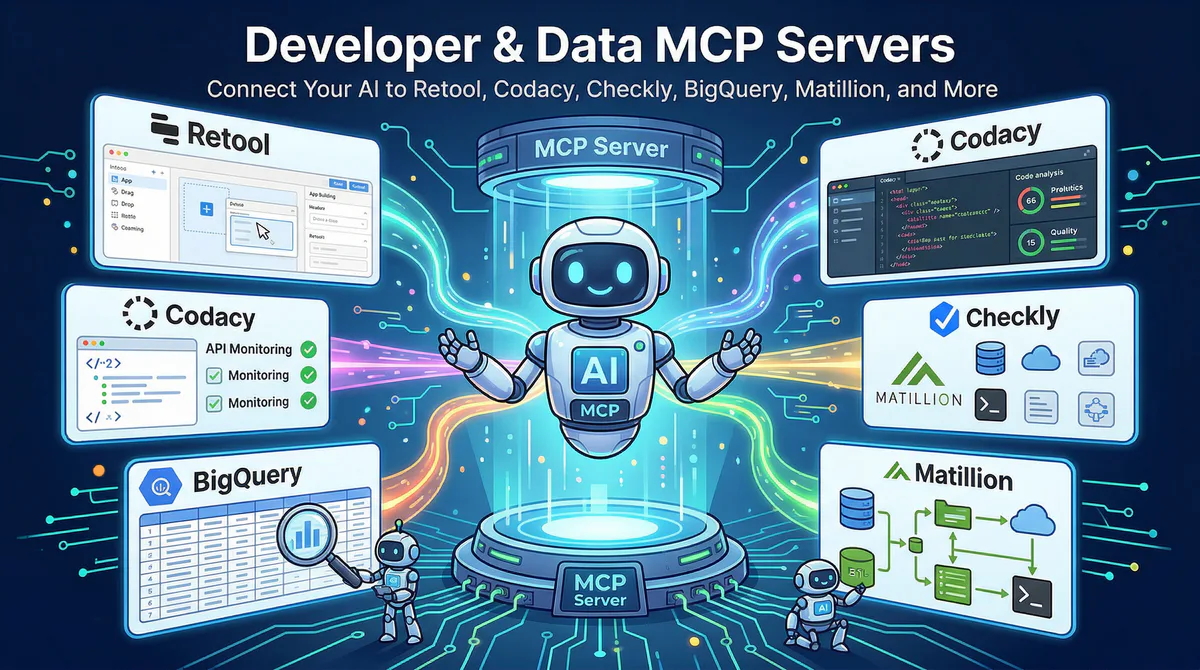
In this guide, we’ll cover every developer tool and data infrastructure MCP server in our catalog — what each one opens up, the workflows it unlocks, and why connecting through our managed gateway matters for security and operations.
Internal Tools & Dashboards
Retool MCP
Retool is the leading platform for building internal tools and admin dashboards — used by over 20,000 organizations including Amazon, DoorDash, and NBC Universal. It sits on top of your existing databases and APIs, providing a visual interface for operations, support, and engineering teams to work with data without writing custom code.
The challenge with Retool is that its data is incredibly valuable but locked behind a web interface. When your AI can query Retool’s data layer directly, your dashboards become conversational.
What your AI can do once connected:
- Query connected databases through Retool’s data layer — without needing direct DB credentials
- Pull dashboard metrics and KPIs — the same data your team sees in Retool apps
- Monitor workflow status — check if automated workflows ran successfully or failed
- Access internal tool data without navigating the Retool UI
Real-world workflows this unlocks:
Operations intelligence. Your head of operations checks the Retool dashboard every morning at 9am. Now they ask: “Pull the latest data from our customer onboarding dashboard — how many customers are in progress, how many completed this week, and are any stuck?” The AI queries Retool’s data layer and returns: “23 in progress, 7 completed this week, 3 marked ‘stuck’ — IDs: CUST-2341, CUST-2355, CUST-2389.”
Executive reporting. Your CEO asks before a board call: “What’s the current order fulfillment rate from the ops dashboard?” Instead of finding someone who has Retool access, remembering which app has this metric, and navigating to the right page, the AI answers directly from Retool’s data: “Fulfillment rate: 94.2%. Down from 96.8% last week. Primary driver: supplier delay on SKU-1847.”
Failure detection. You ask: “Did any Retool workflows fail in the last 24 hours?” The AI checks: “2 failures. ‘daily-revenue-sync’ failed at 3:14 AM (timeout error). ‘customer-notification-batch’ failed at 11:22 AM (API rate limit).”
Example prompts:
- “Pull the latest data from our customer onboarding dashboard in Retool”
- “What’s the current order fulfillment rate from the ops dashboard?”
- “Show me the top 10 customers by revenue from the Retool admin panel”
- “Check if any Retool workflows failed in the last 24 hours”
Connect: Retool MCP in our App Catalog →
Code Quality & Security
Codacy MCP
Codacy automates code reviews and tracks code quality, security vulnerabilities, and technical debt across repositories. It supports over 40 programming languages and integrates into GitHub, GitLab, and Bitbucket pull request workflows. Over 15,000 organizations use Codacy to maintain code health at scale.
What your AI can do once connected:
- Code quality scores — overall grade and trend by repository, branch, or time period
- Security findings — critical, high, medium, and low severity vulnerabilities with remediation guidance
- Technical debt tracking — accumulated debt, trend over time, and biggest contributors
- Code pattern violations — style, complexity, and maintainability issues by category
- Coverage metrics — test coverage percentage and trend across repos
Real-world workflows this unlocks:
Security-first development. Before every release, your security champion asks: “Are there any critical security findings in our main repository?” The AI queries Codacy: “2 critical findings. 1) SQL injection vulnerability in api/users.ts (detected 3 days ago, unresolved). 2) Hardcoded secret in config/prod.ts (detected today).” The release gets blocked until both are fixed — no manual scanning needed.
Technical debt review. In sprint retrospective, the tech lead asks: “How has our code quality score changed over the last 3 months? Are we improving or accumulating debt?” The AI pulls Codacy trend data: “Overall quality: B+ → B- over 3 months. Main driver: complexity increase in the payment module (12 new issues). Coverage dropped from 78% to 71%.”
Pull request context. During code review, a developer asks: “Which files in the repo have the most code pattern violations?” The AI returns: “1) utils/helpers.ts — 23 violations (mostly complexity). 2) api/legacy.ts — 18 violations (dead code). 3) middleware/auth.ts — 14 violations (duplication).”
Example prompts:
- “Are there any critical security findings in our main repository?”
- “How has our code quality score changed over the last 3 months?”
- “Which files have the most code pattern violations?”
- “Show me the technical debt trend for the frontend repo”
- “What’s our test coverage percentage across all repos?”
Connect: Codacy MCP in our App Catalog →
Monitoring & Reliability
Checkly MCP
Checkly provides synthetic monitoring using API checks and Playwright-based browser checks that run from 20+ global locations, ensuring your services are up and performing from your users’ perspective. It’s the “monitoring as code” platform — checks are defined in JavaScript/TypeScript and version-controlled alongside your application code.
What your AI can do once connected:
- Monitor status — which checks are passing, degraded, or failing right now
- Alert history — all triggered alerts with timestamps, affected services, and alert channels
- Performance trends — response time metrics across regions, endpoints, and time periods
- Degradation detection — endpoints that aren’t failing but are getting slower
Real-world workflows this unlocks:
Morning health check. Every morning, your SRE team opens three dashboards. Now they ask: “Are all our Checkly monitors passing right now? If anything is degraded, what changed?” The AI responds: “48 of 50 checks passing. 2 degraded: ‘/api/payments’ — response time increased from 180ms to 620ms in the EU region since 6AM. ‘/checkout/confirm’ — intermittent 502 errors in Asia-Pacific (3 failures in the last hour).”
Cross-region performance comparison. You ask: “Compare our checkout API response time across regions.” The AI pulls Checkly’s global data: “US: 120ms (stable). EU: 180ms (stable). APAC: 340ms (+40% vs. last week). LATAM: 210ms (stable).” Immediately visible: the APAC issue needs investigation.
Incident correlation. During an outage, you ask: “When did our Checkly alerts first fire for the payment service? Show me the timeline.” The AI reconstructs: “First alert: 2:34 PM (response time exceeded 500ms). Second alert: 2:41 PM (first HTTP 500). Third alert: 2:48 PM (full outage). Total time from first symptom to outage: 14 minutes.”
Example prompts:
- “Are all our Checkly monitors passing right now?”
- “Which API endpoints had the highest response times today?”
- “Show me all Checkly alerts triggered this week”
- “Compare our checkout API response time — US vs. EU vs. APAC”
Connect: Checkly MCP in our App Catalog →
BugHerd MCP
BugHerd captures visual bug reports directly from your website — users point, click, and annotate directly on the live page. It automatically captures screenshots, browser information, OS details, screen resolution, and CSS selectors, then organizes everything into a Kanban-style task board.
What your AI can do once connected:
- Access visual bug reports with screenshots and technical metadata
- Task board status — bugs in backlog, in progress, review, and done
- Page-level analysis — which pages have the most reported issues
- Sprint metrics — bugs opened vs. resolved, velocity trends
Real-world workflow: Before a release, your QA lead asks: “How many bugs were resolved vs. opened this sprint? Are there any blockers?” The AI checks BugHerd: “Opened: 14. Resolved: 18. Net: -4 (clearing backlog). 2 marked as blockers: checkout page rendering (IE11) and mobile nav overlap.”
Example prompts:
- “Show me all open bug reports from this week”
- “Which pages have the most BugHerd reports?”
- “How many bugs were resolved vs. opened this sprint?”
Connect: BugHerd MCP in our App Catalog →
Sentry MCP
Sentry tracks application errors and performance in real time. Used by over 100,000 organizations including Disney, Microsoft, and Cloudflare, it’s the standard for production error monitoring. When your AI can query Sentry directly, error investigation starts with a question instead of a dashboard.
What your AI can do once connected:
- Error reports with stack traces, affected files, and code context
- Impact analysis — how many users are affected by each error, how often it occurs
- Release health — crash-free session rates, regression detection, and release comparison
- Trending errors — new errors since a deploy, errors that are increasing in frequency
Real-world workflow: After a deployment, you ask: “Are there any new errors since the deploy at 3pm?” The AI checks Sentry: “3 new errors. 1) TypeError: Cannot read property 'email' of undefined in UserProfile.tsx — 47 occurrences, 12 users affected. 2) TimeoutError in PaymentService.ts — 8 occurrences. 3) 404 on /api/v2/settings — 23 occurrences (likely a missing route in the new version).”
Example prompts:
- “What are the top 5 unresolved errors in production right now?”
- “How many users were affected by the checkout crash today?”
- “Show me the error rate trend for our latest release”
- “Are there any new errors since the deploy at 3pm?”
Connect: Sentry MCP in our App Catalog →
Datadog MCP
Datadog provides full-stack observability — infrastructure metrics, application traces, logs, security monitoring, and CI/CD visibility. With over 28,000 customers and $2.1 billion in annual revenue, it’s the observability platform for modern engineering organizations.
What your AI can do once connected:
- Infrastructure metrics — CPU, memory, disk, network across all hosts and containers
- Log search — full-text search across all ingested logs by service, severity, or message content
- APM traces — request paths, latency breakdowns, and error rates by service
- Alert status — active alerts, acknowledged alerts, and alert history
Real-world workflow: During an incident, your SRE asks: “Show me CPU utilization for the API cluster over the last 6 hours. Also search logs for ‘timeout’ in the payment service.” The AI queries both simultaneously: “CPU: stable at 45% until 2PM, spiked to 92% at 2:34PM, currently 88%. Logs: 147 timeout entries in payment-service since 2:30PM, p99 latency: 4.2s (normal: 200ms).”
Example prompts:
- “Are there any active Datadog alerts right now?”
- “Show me CPU and memory trends for the API cluster — last 6 hours”
- “Search logs for ‘timeout’ errors in the payment service”
- “What’s the p99 latency for our checkout endpoint this week?”
Connect: Datadog MCP in our App Catalog →
PagerDuty MCP
PagerDuty manages incident response, on-call schedules, and alert routing. Used by over 21,000 organizations, it’s the system that wakes people up at 3am when something breaks.
What your AI can do once connected:
- Active incidents — current severity, status, and assigned responders
- On-call schedules — who’s on-call for any team at any time
- Incident metrics — MTTA (mean time to acknowledge), MTTR (mean time to resolve), and incident frequency
- Escalation status — whether incidents have been escalated and to whom
Real-world workflow: Your engineering manager asks on Friday afternoon: “Who’s on-call for infrastructure this weekend? And how many incidents did the team handle last week?” The AI checks PagerDuty: “On-call: Sarah (primary), James (secondary). Last week: 4 incidents. MTTA: 3 minutes. MTTR: 22 minutes. All P3 or lower.”
Example prompts:
- “Are there any open P1 incidents right now?”
- “Who is on-call for the infrastructure team this weekend?”
- “How many incidents this month vs. last month?”
- “What’s our mean time to acknowledge over the last 30 days?”
Connect: PagerDuty MCP in our App Catalog →
Data Infrastructure
BigQuery MCP
Google BigQuery is the serverless data warehouse that can query petabytes of data in seconds. It’s where companies store their analytical data — user events, revenue metrics, product analytics, and machine learning features. Over 30,000 organizations use BigQuery as their primary analytics engine.
When your AI can run queries against BigQuery, every analytical question becomes conversational. No SQL required (though the AI writes it for you if needed).
What your AI can do once connected:
- Run analytical queries across your datasets — in natural language, translated to SQL automatically
- Explore schemas — understand what tables and columns are available without navigating the BigQuery console
- Pull aggregate reports — revenue, users, events, and any other metric you track
- Cohort analysis — segment users by behavior, sign-up date, or any other dimension
Real-world workflow: Your product manager asks: “What’s the 30-day retention rate for users who signed up in January, broken down by acquisition source?” The AI writes the SQL, runs it against BigQuery, and returns: “Organic: 34%, Paid Search: 28%, Social: 21%, Referral: 41%. Referral users have the highest retention by 18 percentage points.”
Example prompts:
- “What’s the total revenue by product category for Q1?”
- “Show me daily active users trend for the last 30 days”
- “Which geographic regions have the highest conversion rates?”
- “Run a cohort analysis on users who signed up in January”
Connect: BigQuery MCP in our App Catalog →
Matillion MCP
Matillion provides cloud-native data integration and ETL (Extract, Transform, Load) for data warehouses like Snowflake, Redshift, and BigQuery. It’s the visual data pipeline platform that lets data teams build, schedule, and monitor data transformations without writing boilerplate code.
What your AI can do once connected:
- Job status monitoring — which jobs ran, which succeeded, which failed, and why
- Pipeline health — end-to-end pipeline performance, bottlenecks, and failure patterns
- Transformation review — what each pipeline does, its dependencies, and its schedule
- Performance optimization — identifying slow-running jobs and suggesting scheduling improvements
Real-world workflow: Your data engineer starts the morning by asking: “Did all Matillion jobs run successfully last night?” The AI checks: “12 of 14 jobs succeeded. 2 failures: ‘daily-revenue-sync’ (timeout after 45 min — usually completes in 12 min — source DB might be under load). ‘customer-enrichment’ (API error: rate limit exceeded).”
Example prompts:
- “Did all Matillion jobs run successfully last night?”
- “Which ETL pipelines failed in the last 24 hours and why?”
- “Show me the run duration trend for the daily revenue pipeline”
- “Which transformations are taking the longest?”
Connect: Matillion MCP in our App Catalog →
Metaplane MCP
Metaplane (now part of Datadog) monitors data quality, freshness, and schema changes across your data stack. It uses machine learning to detect anomalies before they impact downstream dashboards and business decisions.
What your AI can do once connected:
- Anomaly detection — data freshness violations, volume changes, and distribution shifts
- Schema monitoring — broken columns, type changes, and unexpected modifications
- Lineage tracking — column-level lineage showing how data flows through transformations
- Freshness alerts — which tables haven’t been updated when they should have been
Real-world workflow: Before trusting a revenue dashboard, your data analyst asks: “Were there any data anomalies detected by Metaplane in the last 24 hours?” The AI responds: “1 anomaly: revenue_daily table — row count dropped 40% compared to historical pattern. Likely cause: upstream ETL failure at 3AM (confirmed in Matillion if connected).”
Example prompts:
- “Were there any data anomalies detected today?”
- “Which tables haven’t been updated in the last 8 hours?”
- “Show me any schema changes in the production database this week”
- “What’s the data freshness status for our revenue tables?”
Connect: Metaplane MCP in our App Catalog →
The Multi-Tool Developer Workflow
The real power is correlating across the entire developer stack:
| Question | Tool | What it pulls |
|---|---|---|
| ”Are we healthy?” | Checkly MCP | Uptime + response times globally |
| ”Any new errors since deploy?” | Sentry MCP | New exceptions with stack traces |
| ”Is infrastructure under stress?” | Datadog MCP | CPU, memory, network metrics |
| ”Is someone already on it?” | PagerDuty MCP | Active incidents + on-call |
| ”Did the data pipeline break?” | Matillion MCP | ETL job failures |
| ”Is the data trustworthy?” | Metaplane MCP | Data quality anomalies |
| ”Any code quality regressions?” | Codacy MCP | Security findings + debt trend |
| ”What’s the user-reported impact?” | BugHerd MCP | Visual bug reports |
| ”What does the dashboard show?” | Retool MCP | KPI data from internal tools |
One conversation. Nine data sources. Complete operational awareness.
Internal Linking: Related Cluster Guides
- Security & Compliance MCP Servers — Snyk, CrowdStrike, Vanta, Drata
- Brand & Design MCP Servers — Frontify, Figma, Slab, Confluence
- CRM & Sales MCP Servers — Salesforce, HubSpot, Pipedrive
- Communication MCP Servers — Slack, Zoom, Teams
- The Complete MCP Server Directory — 2,500+ apps across every category
How to Connect Any DevTool
- Go to our App Catalog
- Search for the tool
- Click “Subscribe”
- Copy the connection URL
- Paste into Claude, Cursor, or VS Code
Time: under 2 minutes per tool.
Start Building Your AI DevOps Stack
Browse all developer MCP servers →
Your developer tools have all the answers. Your AI should be able to ask the questions. These connections make that possible — with managed hosting, encrypted credentials, and zero maintenance.
Need a dev tool that’s not in the catalog? Email us at support@vinkius.com — we add new servers every week.
Your agents need tools. We make them safe.
Pick an MCP server from the catalog. Subscribe. Copy the URL. Paste it into Claude, Cursor, or any client. One URL — DLP, audit trail, and kill switch included.
V8 sandbox isolation · Semantic DLP · Cryptographic audit trail · Emergency kill switch