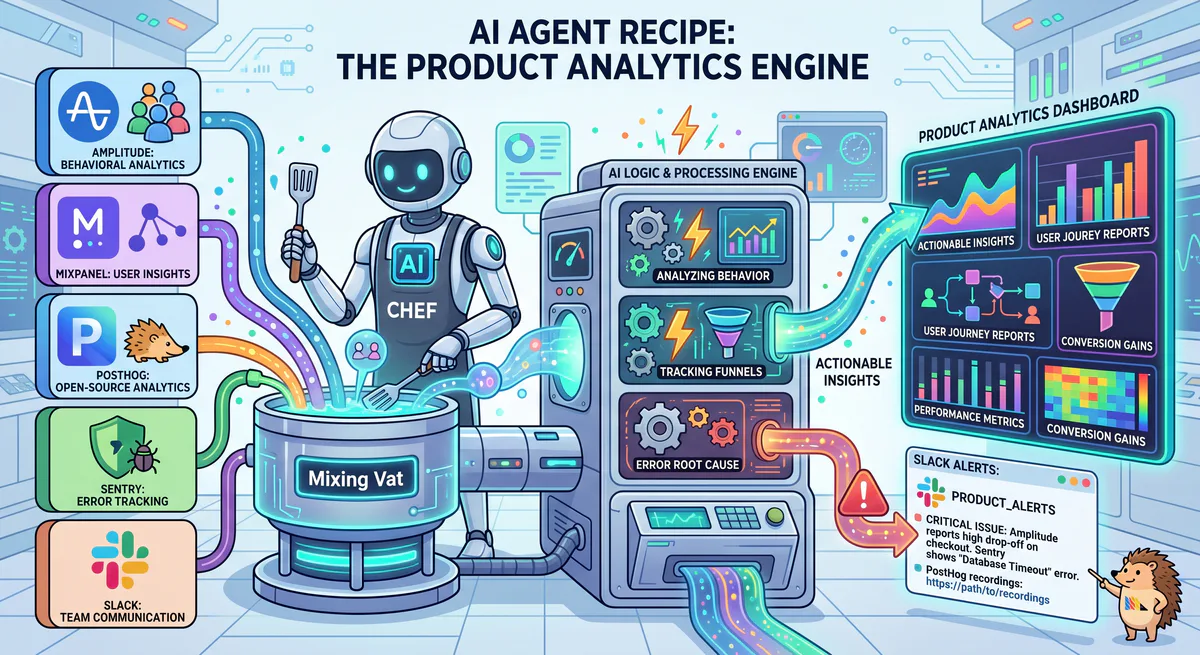
Product teams drown in data but starve for insight. Amplitude tracks user behavior flows. Mixpanel measures event funnels. PostHog runs feature flags and A/B tests. Sentry catches backend errors. Each tool answers one question — but no tool answers the product manager’s real question: “Is this feature working, and should we invest more in it?”
According to Pendo’s 2025 State of Product Analytics Report, product managers spend 5.4 hours per week switching between analytics tools to compile feature performance reports. That’s 280 hours per year — seven full work weeks — spent copying and pasting between dashboards instead of making product decisions.
This recipe connects all four analytics tools into a single AI conversation that delivers cross-tool product intelligence.
The Recipe
| Component | MCP Server | Role |
|---|---|---|
| User Behavior | Amplitude MCP | Cohorts, retention, user journeys, funnels |
| Event Analytics | Mixpanel MCP | Event tracking, segmentation, custom queries |
| Product Experiments | PostHog MCP | Feature flags, A/B tests, session replays |
| Error Monitoring | Sentry MCP | Error rates, stack traces, release quality |
| Team Communication | Slack MCP | Product updates to engineering + design |
Why These Tools Together Create Something New
Every analytics tool gives you a slice. The AI gives you the whole picture:
- Amplitude retention + PostHog experiment data — “Users in the new onboarding variant have 12% higher D7 retention. The experiment is statistically significant.”
- Mixpanel event drop-off + Sentry errors — “42% of users drop off at the payment step. Sentry shows a JavaScript error on that page affecting 8% of sessions. The drop-off is partially a bug, not a UX problem.”
- Feature flag rollout + error rate correlation — “After rolling the new search feature to 50% of users, Sentry error rate increased 3x. Roll back recommended.”
- User cohort behavior + engagement decay — “Users who activate feature X in week 1 have 2.3x higher retention at month 6.”
Real-World Scenarios
Scenario 1: Feature Launch Health Check
“We launched the new collaboration feature 7 days ago. Give me the full health check: adoption rate, activation funnel, user satisfaction, error rate, and comparison with our last feature launch.”
AI response: “Collaboration Feature — 7-Day Health Check:
Adoption (Amplitude):
- Feature exposed to: 100% of users (no flag — full rollout)
- Users who discovered feature: 34% (they visited the feature page)
- Users who activated: 18% (created a shared workspace)
- Users who used it more than once: 11% (returning usage)
Activation Funnel (Mixpanel):
| Step | Users | Drop-off |
|---|---|---|
| 1. Saw feature announcement | 12,400 | — |
| 2. Clicked ‘Try Collaboration’ | 4,216 (34%) | 66% |
| 3. Created shared workspace | 2,232 (18%) | 47% |
| 4. Invited a collaborator | 1,489 (12%) | 33% |
| 5. Both users active in workspace | 892 (7.2%) | 40% |
Biggest drop-off: Step 2→3 (47%). Users click the CTA but don’t create a workspace. Possible: the creation form is too complex or the value isn’t clear.
Error Rate (Sentry):
- Feature-related errors: 127 in 7 days (0.6% error rate for users who accessed the feature)
- Top error:
WebSocket connection failed— 89 occurrences (70% of all feature errors) - Impact: Real-time collaboration requires WebSocket. Users on corporate networks with proxy restrictions can’t connect.
Comparison with Last Feature Launch (Dashboard Redesign — Feb 2026):
| Metric | Dashboard (7-day) | Collaboration (7-day) | Status |
|---|---|---|---|
| Discovery rate | 48% | 34% | ⚠️ Lower (needs promotion) |
| Activation rate | 22% | 18% | ⚠️ Slightly lower |
| Error rate | 0.2% | 0.6% | 🔴 3x higher (WebSocket issue) |
| Returning usage | 15% | 11% | ⚠️ Lower (too early to judge) |
Recommendations:
- Fix the WebSocket error — it’s blocking 70% of error-affected users. Consider: fallback to SSE polling for corporate proxy environments.
- Simplify workspace creation — the 47% drop-off suggests friction. Consider: a ‘Start Collaborating’ one-click that auto-creates a workspace.
- Increase feature discovery — 34% vs. 48% for Dashboard launch. Add an in-app tooltip or modal announcement.
Post to #product-team?”
Scenario 2: A/B Test Decision
“The new pricing page experiment has been running for 2 weeks in PostHog. Check the results. Cross-reference with Mixpanel: do the two variants differ in downstream behavior (trial-to-paid conversion, time-to-upgrade)?”
AI response: “Pricing Page A/B Test Results:
PostHog Experiment:
- Control (current page): 5,400 visitors
- Variant B (new simplified pricing): 5,200 visitors
- Duration: 14 days
- Statistical significance: Yes (p=0.03)
| Metric | Control | Variant B | Lift | Significant? |
|---|---|---|---|---|
| Click ‘Start Free Trial’ | 8.2% | 11.4% | +39% | ✅ Yes |
| Scroll past fold | 62% | 78% | +26% | ✅ Yes |
| Time on page | 2:12 | 1:48 | -18% | ✅ Yes (faster decision) |
PostHog verdict: Variant B wins on primary metric (trial starts).
Downstream behavior (Mixpanel — requires 14+ days of data):
| Event | Control Trials | Variant B Trials | Notable? |
|---|---|---|---|
| Completed onboarding | 64% | 58% | ⚠️ Variant B slightly lower |
| Trial → Paid conversion (14d) | 22% | 19% | ⚠️ Variant B slightly lower |
| Chose annual plan | 38% | 44% | ✅ Variant B higher |
| Average revenue per conversion | $24.80/mo | $27.20/mo | ✅ Variant B higher (+9.7%) |
Cross-tool insight: Variant B gets more people to start trials (+39% lift) but fewer convert to paid (-3% trial-to-paid). However, those who DO convert choose higher-value plans (+9.7% revenue per conversion).
Net revenue impact calculation:
- Control: 5,400 × 8.2% × 22% × $24.80 = $2,415/month from cohort
- Variant B: 5,200 × 11.4% × 19% × $27.20 = $3,064/month from cohort
Variant B generates 27% more revenue despite the lower trial-to-paid rate. The higher trial volume and higher plan selection more than compensate.
Recommendation: Ship Variant B. But investigate why onboarding completion is lower (58% vs. 64%) — the simplified pricing page may attract less-committed users who need more onboarding support.”
Scenario 3: Release Quality Gate
“We’re about to ship v4.2. Check Sentry error rates for the release candidate in staging. Compare with v4.1’s error rate at launch. Cross-reference Amplitude: are beta testers hitting the new features? Any red flags?”
AI response: “Release Quality Gate — v4.2 RC:
Sentry (Staging Environment):
- Total errors in RC (7 days): 34
- Error rate: 0.18% (per-session)
- v4.1 at same stage: 28 errors, 0.15%
- Delta: +21% more errors than v4.1 RC ⚠️
Top errors:
| Error | Count | Severity | New in v4.2? |
|---|---|---|---|
TypeError: Cannot read 'undefined' | 12 | Medium | ✅ New — introduced in commit abc123 |
API timeout: /api/search | 8 | Low | ❌ Existing (intermittent) |
Memory leak: Canvas component | 6 | 🔴 High | ✅ New — introduced in PR #847 |
| Other | 8 | Mixed | — |
🔴 Blocker: The Canvas memory leak (6 occurrences) causes the browser tab to crash after 15+ minutes of use. This was introduced in PR #847 (the new drawing feature).
Beta tester behavior (Amplitude):
- 142 beta users active on v4.2 RC
- 68% tried the new drawing feature (Canvas component) ✅
- Average session duration: 8 minutes (vs. 12 minutes on v4.1) ⚠️
- 12 users reported ‘page crash’ — correlates exactly with the Sentry memory leak
Recommendation: DO NOT SHIP v4.2. The Canvas memory leak is a P0. Users are already experiencing crashes after 15 minutes. Fix the leak in PR #847, re-run the RC for 48 hours, then re-evaluate.
Notify @engineering-lead in Slack?”
Security Considerations
- User behavior data — aggregated analytics, no individual PII unless configured
- A/B test configurations — protected from leaking to competitors
- Error stack traces — may contain internal code paths, DLP can redact
- All platform credentials (Amplitude API key, PostHog API key, Sentry auth) — encrypted vault
- Session replay data — PostHog sessions may contain PII; excluded from AI access by default
How to Set It Up
- Subscribe in our App Catalog:
- Paste URLs into Claude or Cursor
- Ask: “How is the new feature performing?”
Variations
- Add Hotjar for heatmaps → Hotjar MCP
- Add FullStory for session replay → FullStory MCP
- Add Heap for auto-capture → Heap MCP
- Replace Slack with Linear for issue creation → Linear MCP
Related Guides
- DevOps War Room Recipe → — Incident response recipe
- Developer & Data MCP Servers → — DevTools cluster
- Database MCP Servers → — Supabase, PostgreSQL
- The MCP Server Directory → — 2,500+ apps
Your agents need tools. We make them safe.
Pick an MCP server from the catalog. Subscribe. Copy the URL. Paste it into Claude, Cursor, or any client. One URL — DLP, audit trail, and kill switch included.
V8 sandbox isolation · Semantic DLP · Cryptographic audit trail · Emergency kill switch